
Review Request Report – See How Your Review Request Emails Are Performing
Overview
The Review Request Report helps you track the performance of your review request emails. It provides key metrics such as Sent, Opened, Clicked, Reviewed, and % Reviewed, giving you a clear view of how your email campaigns are performing.
This report allows you to quickly evaluate the effectiveness of your email channel and identify areas for improvement — for example, adjusting your send schedule, refining the email content, or optimizing your review reminder timing to increase review rates.
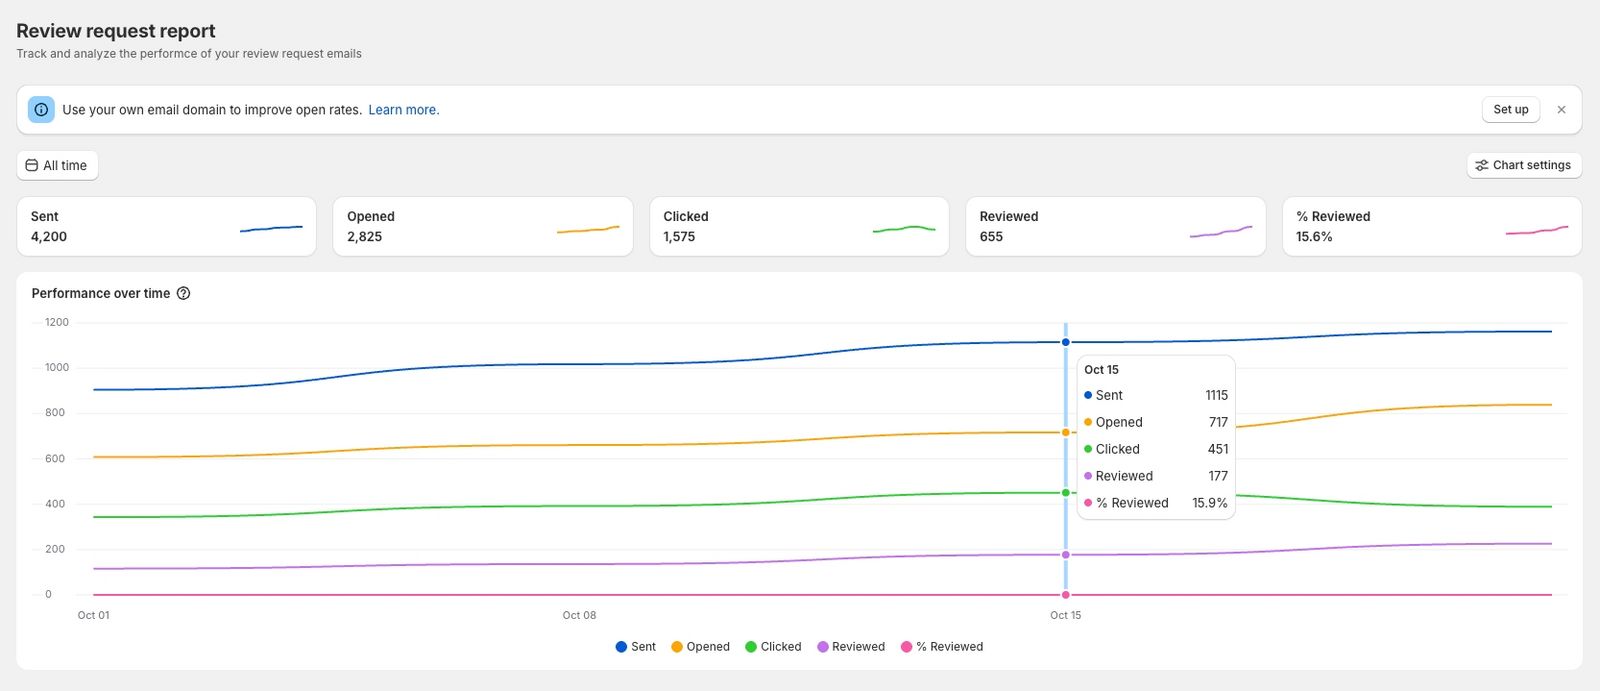
Understanding Key Metrics
- Sent – The number of emails successfully sent to customers.
- Opened – The number of emails that customers opened.
- Clicked – The number of emails where customers clicked at least one link.
- Reviewed – The number of emails that resulted in a submitted review.
- % Reviewed – The review rate based on sent emails, calculated as: % Reviewed = (Reviewed / Sent) × 100
Chart Filters and Settings
Customize the report to show the data that matters most to you.
Time FilterChoose a time range to display metrics for a specific period (e.g., Last 7 days, Last 30 days, Last 90 days).
Show Values AsSelect how you want the metrics displayed on the chart:
- Count – Show actual numbers (e.g., 120 emails opened).
- Percentage – Show proportions (e.g., 60% opened).
Choose which type of email you want to include in the report:
- All – Include all types of review request emails.
- Review Request – Only include initial review request emails.
- Review Reminder – Only include reminder emails.
Metrics to Display
Select which metrics you want to show on the chart. You can toggle each metric on or off at any time.
- Sent
- Opened
- Clicked
- Reviewed
- % Reviewed
Important Notes
Depending on your selected date range, the data may be grouped into broader time intervals for easier visualization:
- For Last 30 days, data may be grouped by day, e.g., Day 1 and Day 2 combined and shown as the starting date of that range.
- For Last 90 days, data may be grouped by week, with each data point representing the first day of the week.
This helps the chart display trends more clearly over longer periods.
Related Actions
- Improve your open rates: Use your own domain to send review request emails. Learn how.
- Track individual emails: View your Review Request History to see the status of each email sent. Learn how.
Updated on: 21/03/2026